Correlation in signal processing is the similarity of two signals. The correlation filter offers the functionality to remove or isolate those parts of a signal which are similar to a certain reference. Therefore, the possibility exists to add one or several reference channels when signals are being recorded with a microphone array. Alternatively, reference channels can be generated from acoustic maps or imported as audio files. Regardless of the method chosen to obtain the reference signal, the pursued target remains the same: to point out the impact of the reference channel and its included sound sources on the calculated acoustic map.
It is assumed that the signal \(x_{ mic }(t) = x_{ uncorr }(t)+x_{ corr }(t)\) is comprised of the signal \(x_{ uncorr }(t)\) which is independent of the reference signal \(x_{ ref }(t)\) and \(x_{ corr }(t)\) which correlates with the reference signal.
A further assumption is that the correlated part \(x_{ corr }(t)\) itself consists of the sum of temporally shifted and scaled repetitions of the reference signal (e.g. by multiple reflections):
$$x_{corr}\left(t\right)=\ \sum_{n=1}^{N}{\alpha_n\cdot x_{ref}(t-\tau_n)}.$$
The magnitude of the correlation function between \(x_{ mic }(t)\) and \(x_{ ref }(t)\) is taken to calculate the time shift \(τ_n\) by identifying the biggest local maximum. That followed, the corresponding factor \(∝_{ n }\) is calculated by optimization. The summand obtained is now removed from the signal while the procedure is repeated \(N\) times with the leftover signal. In doing so, \(N\) indicates the filter order or the number of iterations, respectively. In the end, either \(x_{ corr }(t)\) or \(x_{ uncorr }(t)\) are being removed from the original microphone signal \(x_{ mic }(t)\) depending on the selected correlation filter mode.
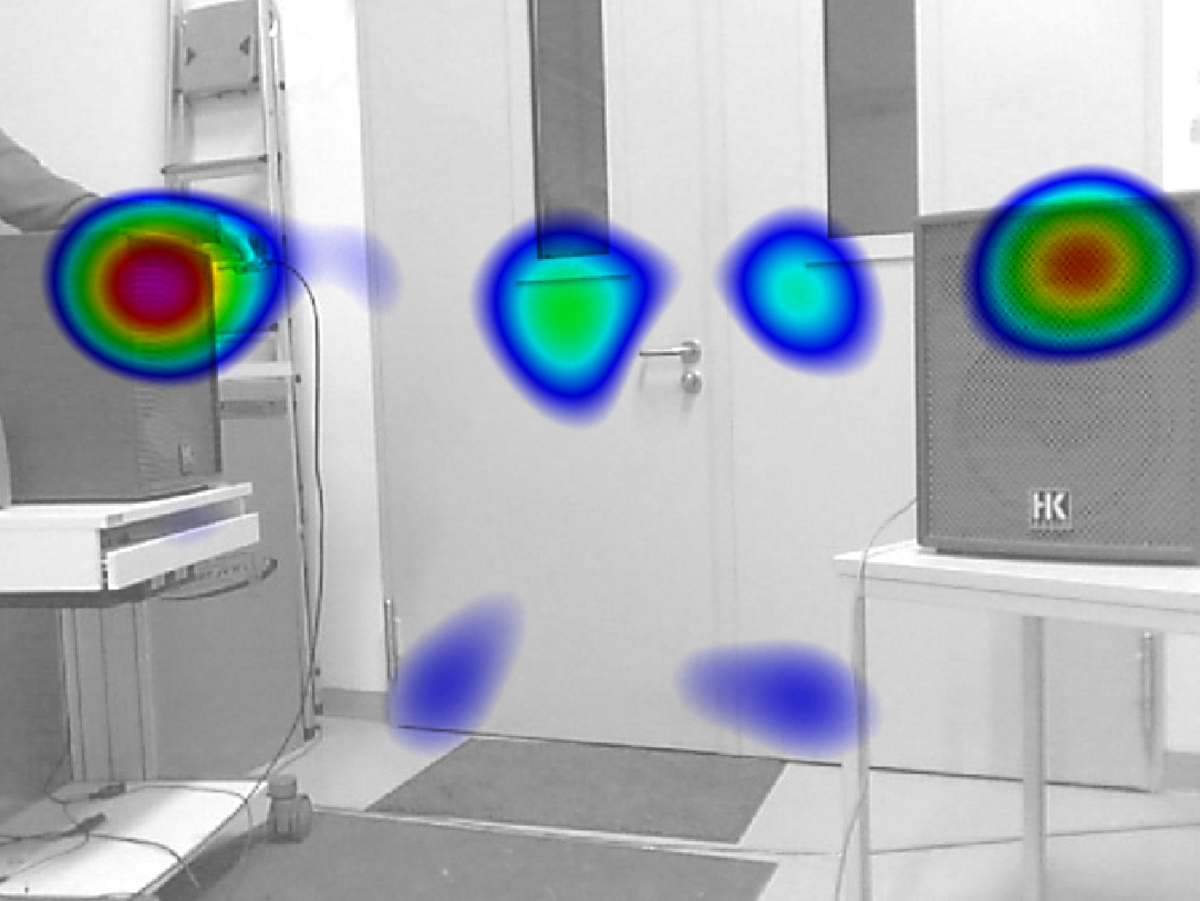
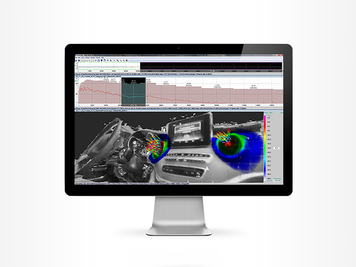
Appication Example: Speakers
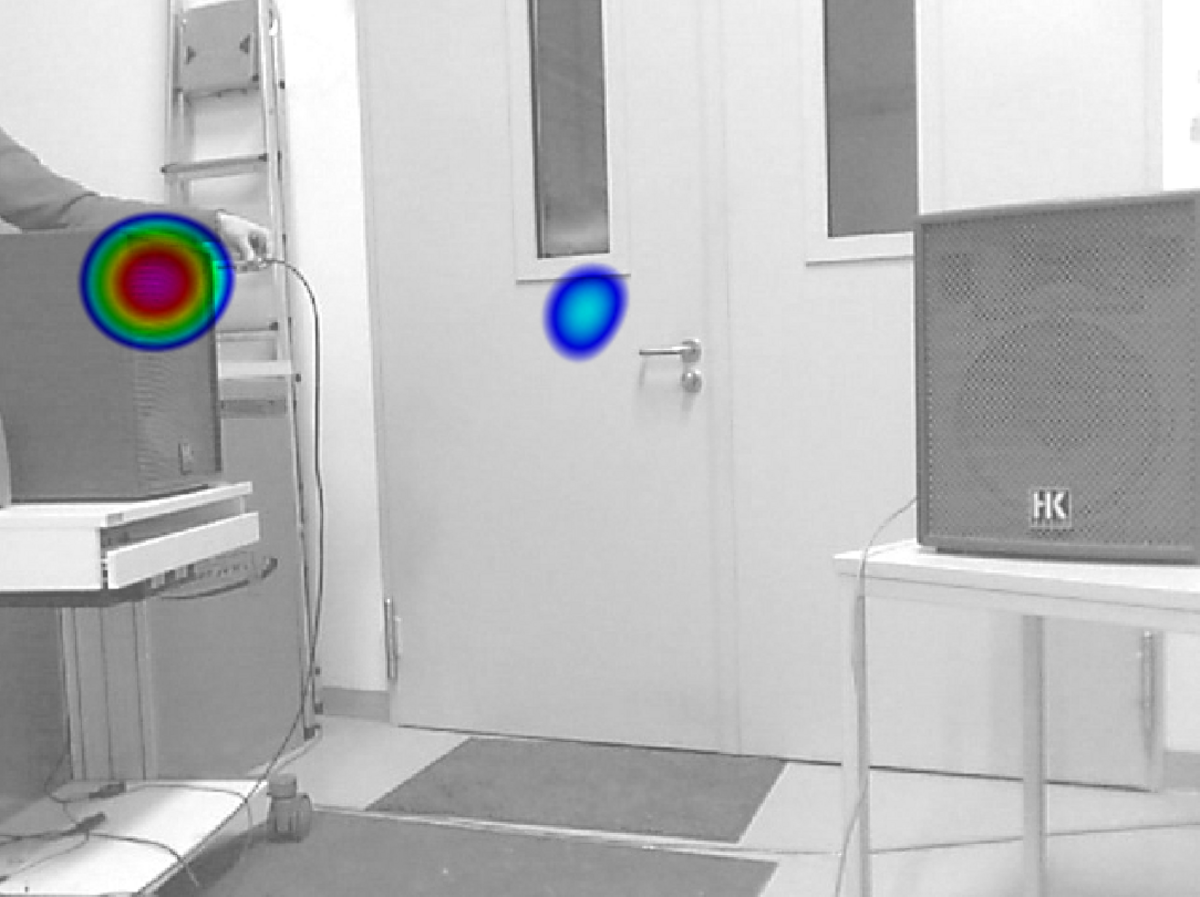
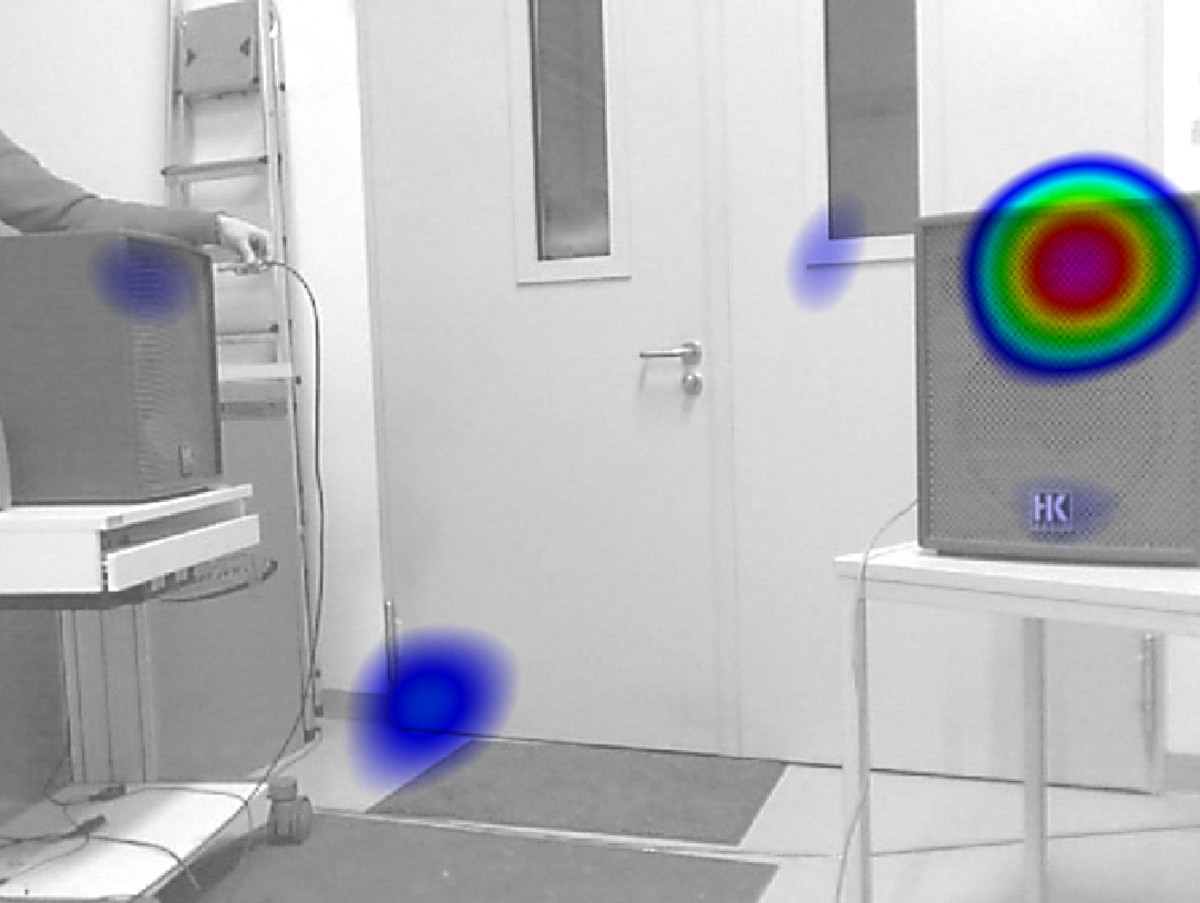
Fig. 1 shows the acoustic map of two speakers within the 8 kHz third-octave band which emit incoherent signals (non-in-frequency and non-in-phase). In between, several other possible sound sources appear. It is assumed that they are caused by reflections of the left speaker which is also the source of the reference signal. Fig. 2 shows the acoustic map of the correlating parts at filter order \(N=10\) whereas Fig. 3 shows the uncorrelated parts at \(N=45\). This supports the assumption that the sound source at the left door wing underneath the window correlates with the left speaker and is a reflection of the signal emitted by the left speaker. All acoustic maps have been calculated using functional beamforming at \(ν=4\).