Metrological determination of vehicle noise from conventional trucks

Acoustic Mapping of Trucks

Reducing vehicle noise is becoming increasingly important in freight transport. Statutory limit values, rising noise protection requirements and the use of lorries in sensitive areas such as residential areas or logistics centres necessitate a precise analysis of noise emissions.

A thorough acoustic investigation using the acoustic camera provides the basis for assessing the noise behaviour of lorries under realistic operating conditions. The measurement data obtained serves as a reliable basis for approval procedures, noise abatement schemes and compliance with statutory noise limits.

Pass-by Measurement with Acoustic Camera

Our high-performance Acoustic Camera is used for the metrological analysis of noise from passing lorries. It detects and localises sound sources as the lorry passes by, enabling a detailed acoustic analysis under real-world operating conditions. This allows noise-relevant components such as the engine, tyres, drivetrain or attachments to be specifically identified and assessed.

Measurements

Localisation of sound sources from passing lorries using beamforming

Measurement Object

Heavy-duty truck with trailer

•    Truck travelling at a speed of approx. 50 km/h

Measurement Set-up

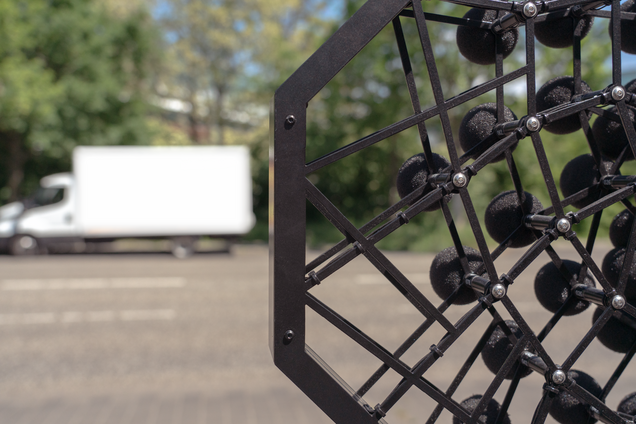
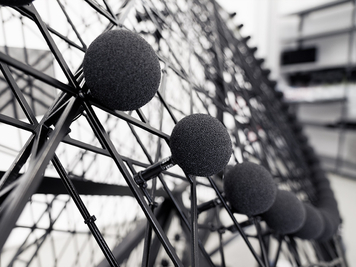
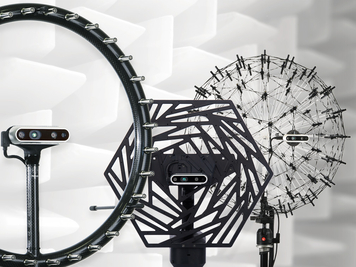
Two Acoustic Cameras were used for the measurements: the Star48 and the Fibonacci AC Pro. They were installed one after the other on the pavement, 10 metres from truck to array. The road surface was in good condition along the measurement section. The noise emission measurements were carried out on a busy public road.

 All arrays can be mounted flexibly. The Star48 array can be set up and unfolded in an open field in a matter of seconds.

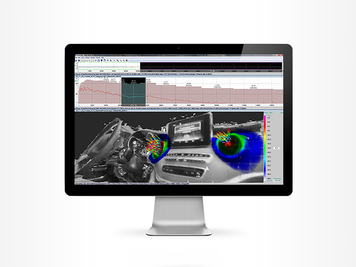
Following the measurement, the software first combines the video signal to create a visual panoramic image, whilst determining the speed profile. In the second step, the time-synchronised audio data is used to calculate an acoustic map of the entire vehicle. With one click and within a few minutes only, sound sources or specific frequency ranges that contribute significantly to the overall noise can be precisely localised.

However, the vehicle’s movement affects how we perceive its sound. This results in an apparent change in frequency. This phenomenon is known as the Doppler effect or Doppler shift, and is corrected by our PassBy 2D module using a customised beamforming algorithm.


System Characteristics

Star 48 microphone array

  • 48 microphones
  • 3.4 metres in diameter
  • Recommended mapping frequency: 66 Hz – 13 kHz
  • Dynamic range: 9 dB – 14 dB, up to 50 dB with advanced algorithms (Power Beamforming, CLEAN-SC)
  • Typical measurement distance: > 4

Fibonacci AC Pro Microphone Array

  • 96 microphones
  • 0.79 metres in diameter
  • Recommended mapping frequency: 245 Hz – 20 kHz
  • Dynamic range: 15 dB – 22 dB, up to 50 dB with advanced algorithms (Power Beamforming, CLEAN-SC)
  • Typical measurement distance: > 0.8 m

gt4 data recorder

  • Sampling rate 192 kHz
  • Up to 100 time-synchronised analogue channels 
  • Ethernet interface > high data transfer rate of up to 1 Gbit •    Integrated Mobile Power supply with two exchangeable power tool batteries

NoiseImage software

  • PassBy2D- module: for generating the panoramic image and calculating a spectral acoustic map for the vehicle along its entire lengthRecording module

Results

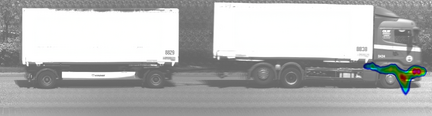
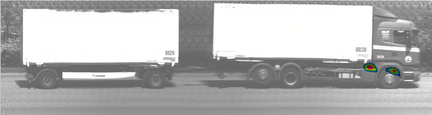
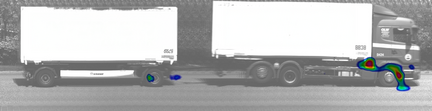
The Acoustic Camera measurements identified the main vehicle noise sources as tire–road rolling noise and the powertrain. Rolling noise is generated by vibrations of the tire tread and carcass caused by the interaction between the tire and the road surface. Powertrain noise originates from the engine and drivetrain components. The measurements show that rolling noise becomes the dominant source at higher vehicle speeds, while powertrain noise is more significant at lower speeds and during acceleration.

Sound sources at truck

Sound sources at truck

Ideal for:

  • Vehicle and truck manufacturers
  • Tire manufacturers
  • Test laboratories
  • Certification and homologation teams
  • Railway vehicle manufacturers
  • Acoustic engineering departments

Typical applications

  • Exterior vehicle noise analysis
  • Tire-road noise localization
  • Powertrain and exhaust noise detection
  • Rattle and component noise analysis
  • Pass-by testing during acceleration
  • Validation of noise-reduction measures

What you can achieve

  • Localize individual noise sources on moving vehicles
  • Separate tire, engine, drivetrain and aerodynamic noise
  • Analyze frequency-dependent behavior
  • Compare different vehicle states and speeds
  • Document results visually for development reports
  • Reduce time spent on repeated manual measurements

Example of Pass-by Measurement

By activating external content from Youtube, you consent to transmitting data to this third party.

Pass-by Measurement of an ICE train with Acoustic Camera

In this video, acoustic measurements were performed on an ICE high-speed train. When measuring moving objects, the sound sources are located at different points on the acoustic map at any given time. In addition, the so-called Doppler effect changes the spectrum and the time course of the amplitude of the radiated signal at the receiver. Conventional beamforming methods therefore lead to diffuse acoustic maps.

The NoiseImage software module PassBy was specially developed for moving measurement objects. It takes motion into account and eliminates the Doppler effect. Thus, exact acoustic maps can be calculated even for fast moving objects.

 

How the Delay-and-Sum Beamforming Works

The delay-and-sum beamforming technique used in the PassBy module is widely used to analyze and localize sound sources, including those generated by fast-moving objects. When applied to fast-moving objects such as trains, the delay-and-sum beamforming algorithm adjusts the time delay and amplitude of the signals received by each microphone in the array. Dynamic sound sources can thus be effectively tracked and localized.

In the case of fast-moving objects such as a passing train, the sound signals picked up by the microphones exhibit frequency changes due to the Doppler effect. The Doppler effect occurs when the source of a sound signal passes a fixed position of the observer and the measurement tool, causing a change in the perceived frequency.

To account for this, the delay-and-sum beamforming algorithm takes into account the speed and direction of the moving object, such as a train, and adjusts the time delay and amplitude of the microphone signals accordingly. By taking into account the Doppler effect and compensating for the frequency shifts caused by the moving train, the algorithm can provide accurate measurements of the actual sound characteristics of the passing train.