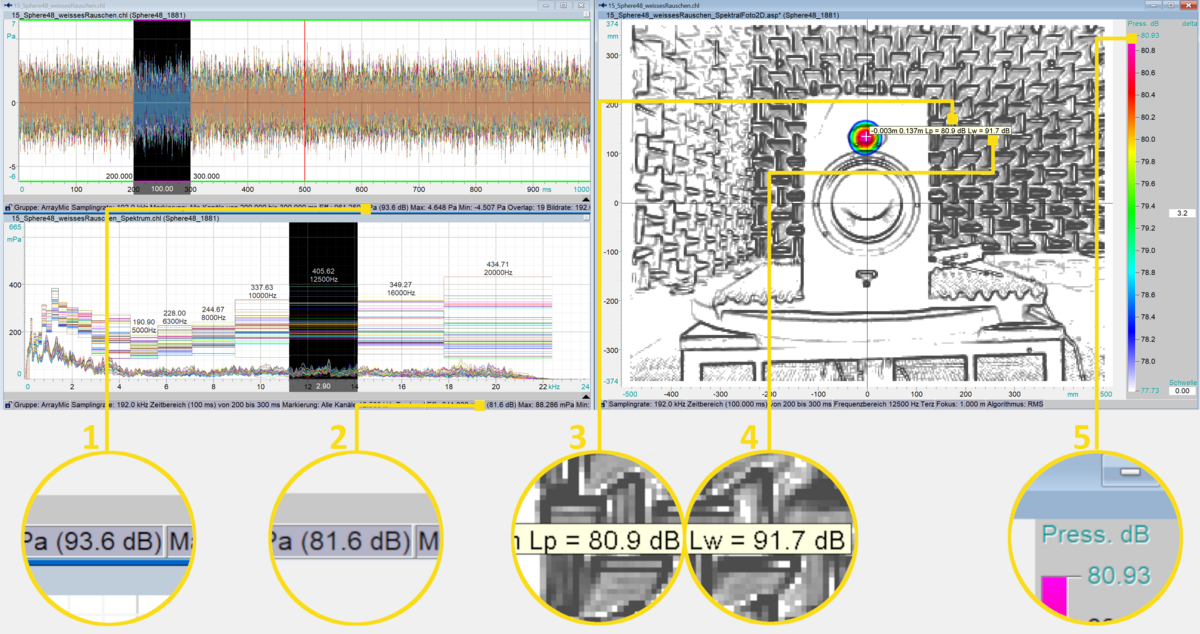
In the graphical user interface of NoiseImage, different sound pressure levels are shown that are designed to help the user assess and evaluate the measurement results, see Fig. 1.
- (93.6 dB) The average root-mean-square (RMS) of all active microphone channels is shown in the status bar of the channel view with respect to the selected time interval. Unless a time interval is selected, the calculation is performed over the entire measurement time.
- (81.6 dB) In the status bar of the spectrum, the average RMS of all active microphone channels is given with respect to the selected time and frequency interval. Unless a frequency interval is selected, the calculation is performed over the entire frequency range.
The following three dB-values relate to the acoustic map. These values depend on the settings of the applied plug-ins.
- (80.9 dB) Lp (tooltip) denotes the sound pressure level at the position of the mouse cursor, independent of the given resolution of the acoustic
- (91.7 dB) Lw (tooltip) denotes the sound power level at the position of the mouse cursor. The calculation is based on the assumption of a point source at the position of the mouse cursor.
- (80.93 dB) The highest dB-value in the colour bar of the acoustic photo indicates the maximum sound pressure level in the map, depending on its resolution.