The calculation of an acoustical map can be quite time-consuming depending on the hardware that is used. Defining the calculation parameter “resolution”, the quality of the acoustical map and consequently, the calculation time can be influenced. In the analysis software NoiseImage, this parameter is to be found in the properties dialog of the Photo 2D module. The number of pixels along the X-axis is determined by this parameter.
Furthermore, the frequency range of the expected source needs to be considered when selecting the resolution value. Sources with a high-frequency spectrum, for instance, need to be investigated with a higher resolution due to the low three-dimensional expansion. Otherwise, it may happen that a source is not correctly localized or even not at all.
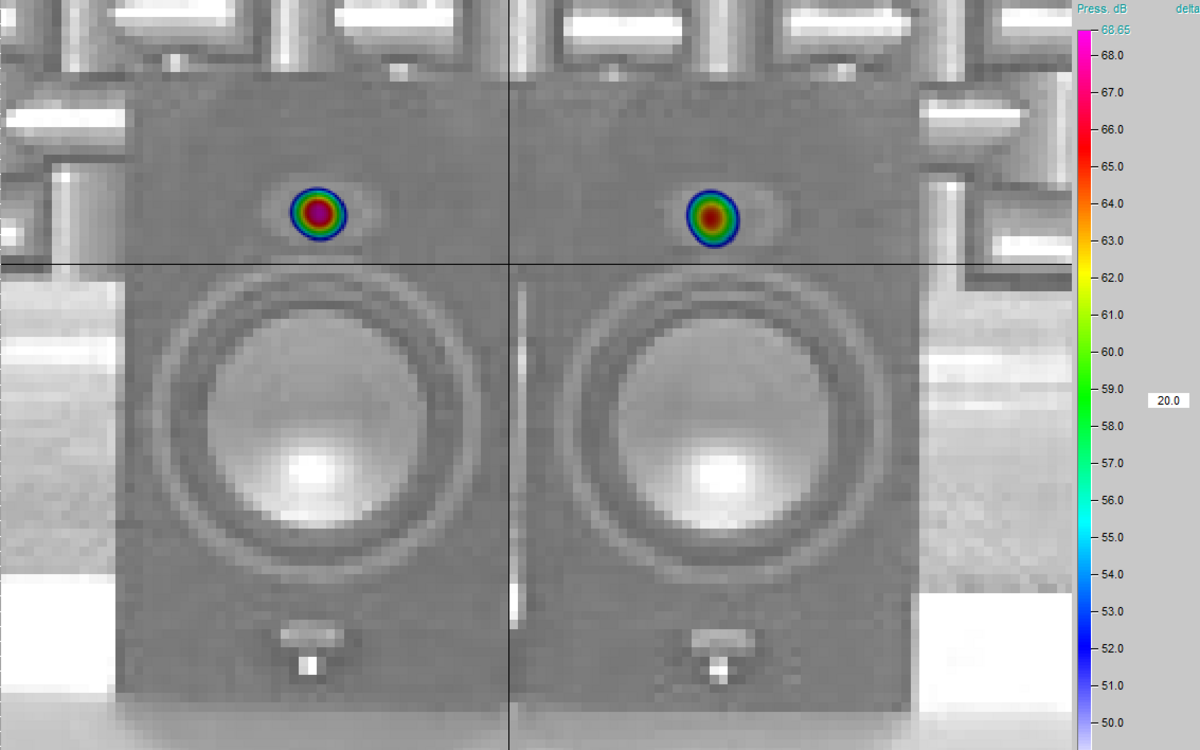
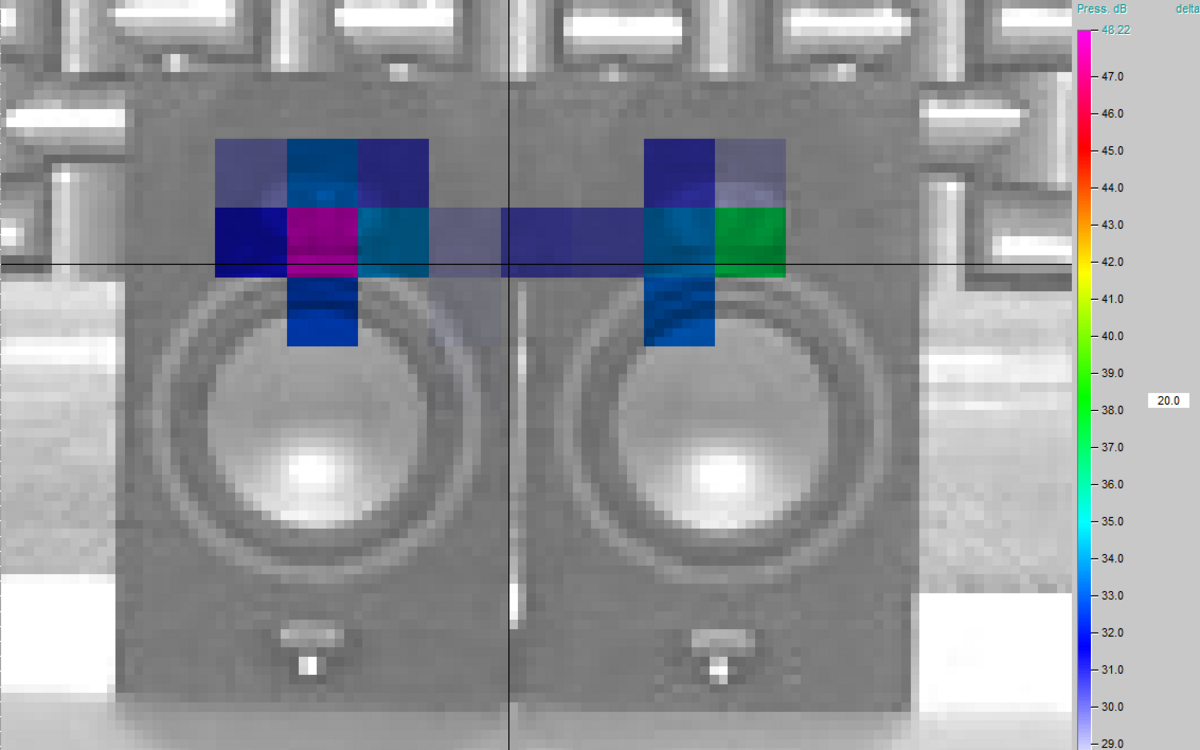
Figures 1-4 illustrate what happens if the resolution value was too low.
All acoustics maps have been calculated using the same parameters (Power Beamforming, 20 dB representation) except the resolution which ranges from 15 to 500 pixels/X-axis.
The sound sources in figures 1 and 2 have been localized correctly. Their maximum sound-pressure levels of 68.6 dB are almost identical. The further reduction of the resolution has an impact on the quality of the acoustic maps and sound-pressure levels (68.3 dB) as shown in Fig. 3.
Fig. 4 illustrates that the Power Beamforming algorithm has failed. The localization and the sound-pressure level are not correct. This is because only the position of the center of one pixel is included in the calculation. If the spatial size of the source is smaller than 1 pixel, the calculation of an acoustical map is not granted particularly at high frequencies.