The Acoustic Camera as Solution for Rotating Machinery

Order Analysis on Gearboxes

Facing the need for an energy revolution to mitigate climate change and increasing prices for steel there are huge incentives to drive innovation on large scale gearboxes to increase power density. The requirement to handle more power using less resources, increases the importance of understanding the dynamic behavior of the plant. When analyzing rotating machinery, it can be a complex task to allocate different excitation frequency components to specific parts in an assembly. The signal is a superposition of mainly multiples of the rotational frequency, the so called first order. A typical component exhibiting this behavior is a gearbox where every gear stage adds prominent orders with its gear mesh frequency.

Measurements

Measurement object

Gearbox wind turbine of Flender GmbH

Measurement setup

The foldable customized EVO array is set up in three different positions:

  • Side view (standing operation)
  • Top view (suspended from indoor crane 90°)
  • Global view (suspended from indoor crane 45°)

In addition to the 72 microphones, 24 individual rotational speed sensors and accelerometers are recorded simultaneously. The data recorder is mounted on the array frame.

The array can be folded for easier transport and shipping.

System Characteristics

Microphone array: customized Evo array

  • 72 microphones, ring distribution
  • diameter: 2.3 m
  • Recommended mapping frequencies: 200 Hz - 13 kHz
  • Dynamic range: 16 dB - 24 dB, up to 50 dB with Advanced Algorithms
  • Typical measurement distance: 4 - 20 m

Data recorder mcdRec

  • 192 kHz sampling frequency
  • up to 168 time-synchronized, analog channels (7 cards with 24 channels each)
  • Ethernet interface > high transfer rate > 20 MByte/s, network-compatible
  • Digital card with 12 extra channels for recording of RPM, rotation angle,  reversal point, etc.
  • Integrated PC with Windows XP (embedded)

Software NoiseImage


Results

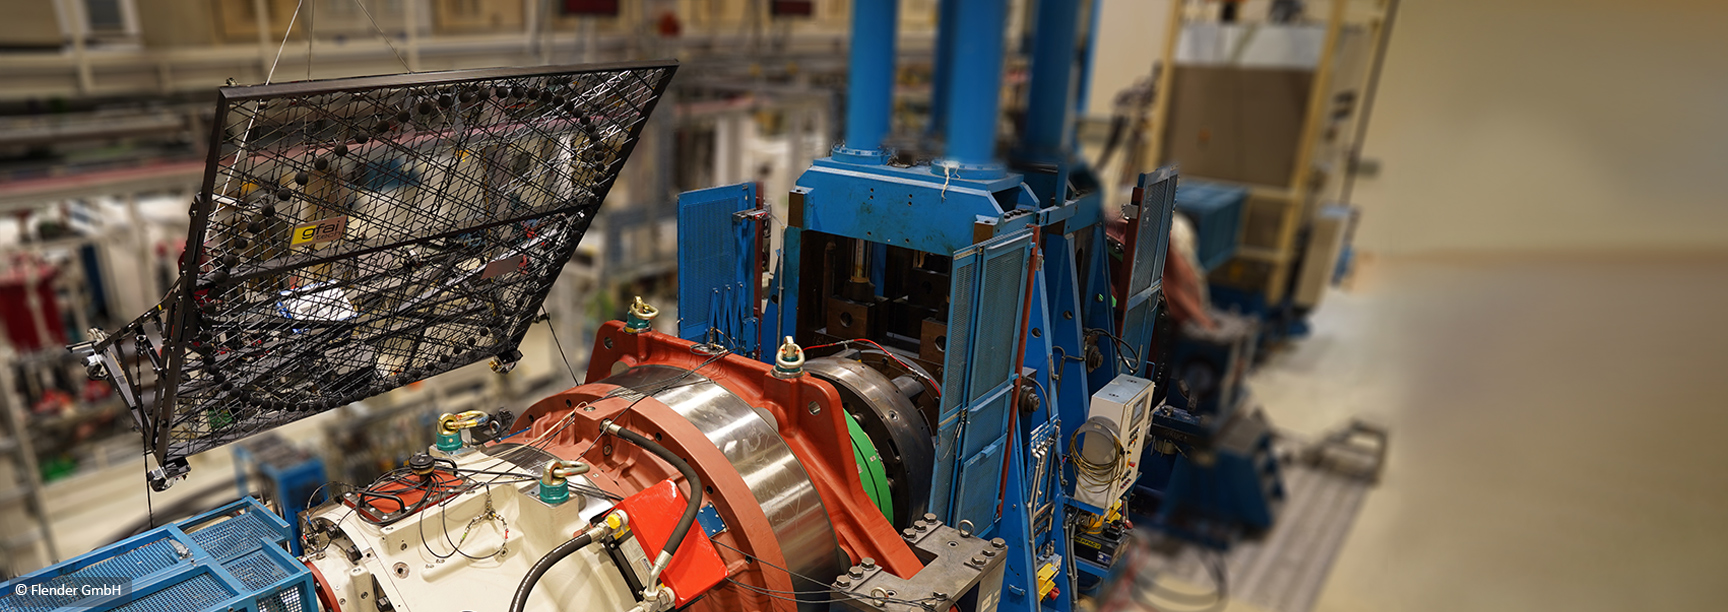
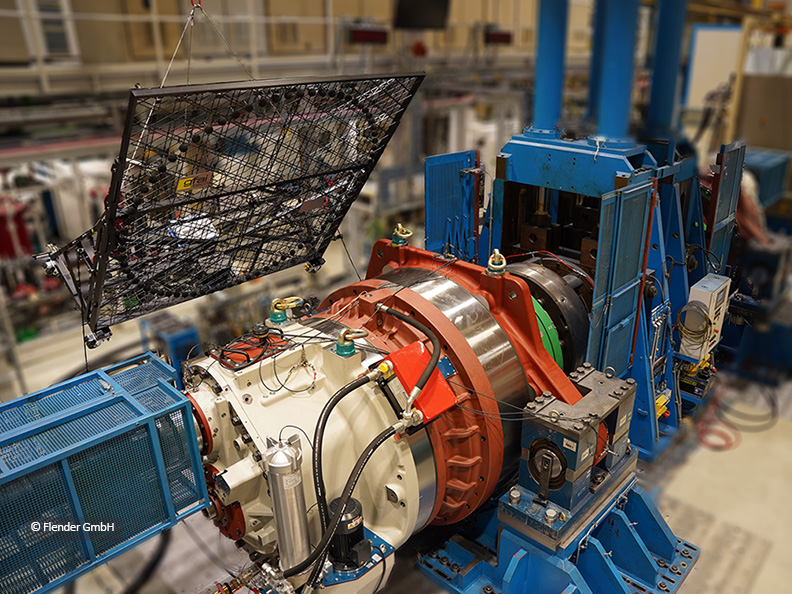
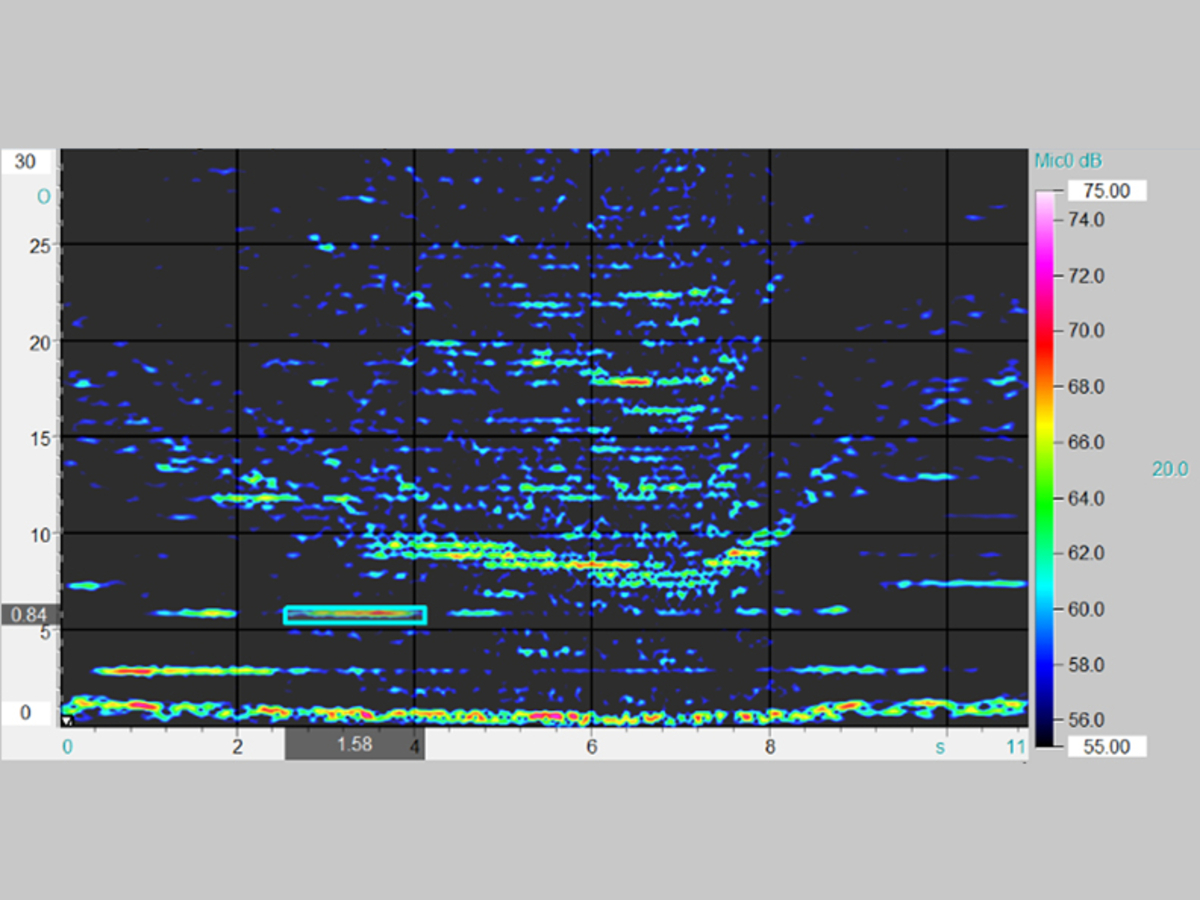
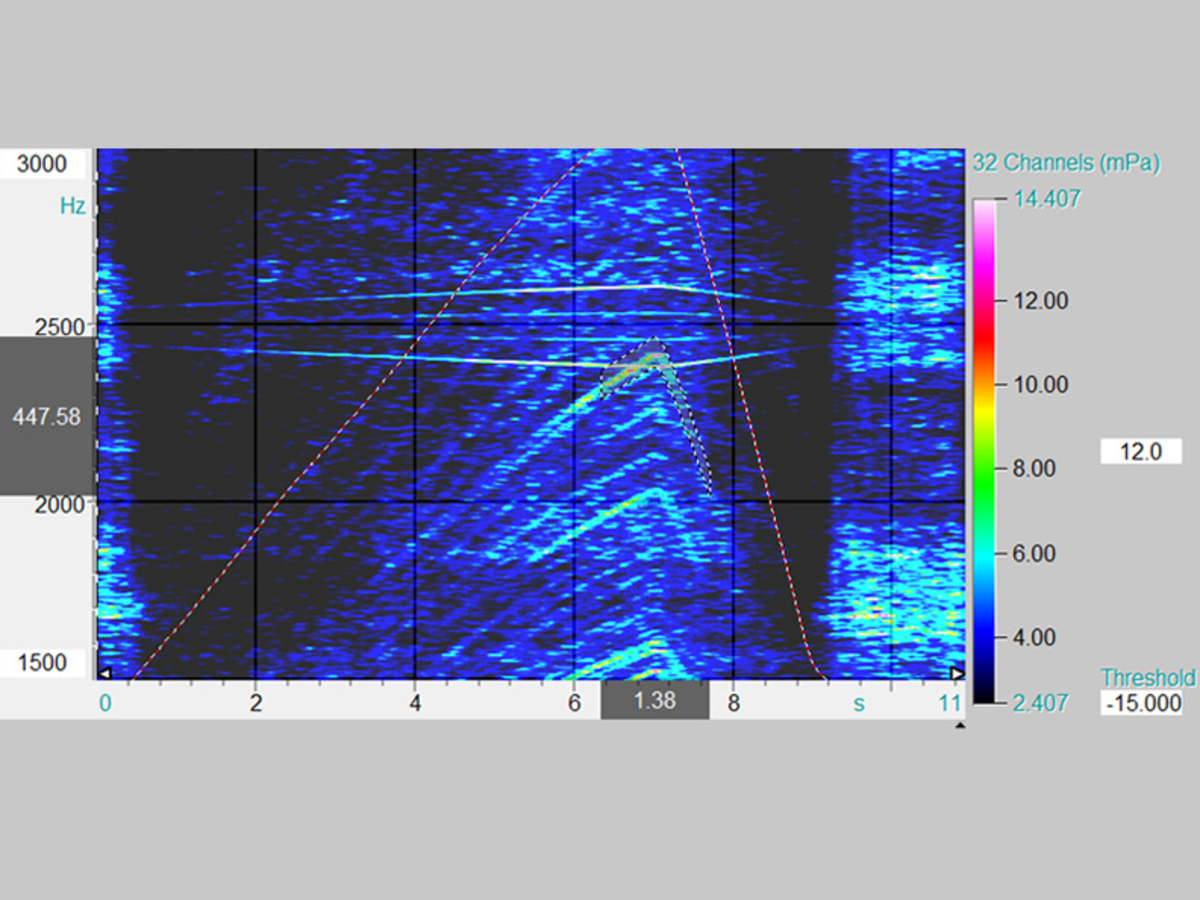
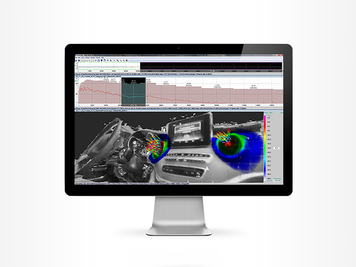
Some distinction can be made interpreting data in a spectrogram. An easier and quicker way to distinguish orders and quantify the acoustic emissions is an analysis based on orders (order analysis). NoiseImage 4 and the Order Analysis module allow to calculate acoustic maps via ordergram, order line selection in the spectrogram (Figure 1), or order spectrum (Figure 2). This gives way to fast analysis of all-sizes machines ranging from large scale infrastructure as shown to small items in the range of centimeters.

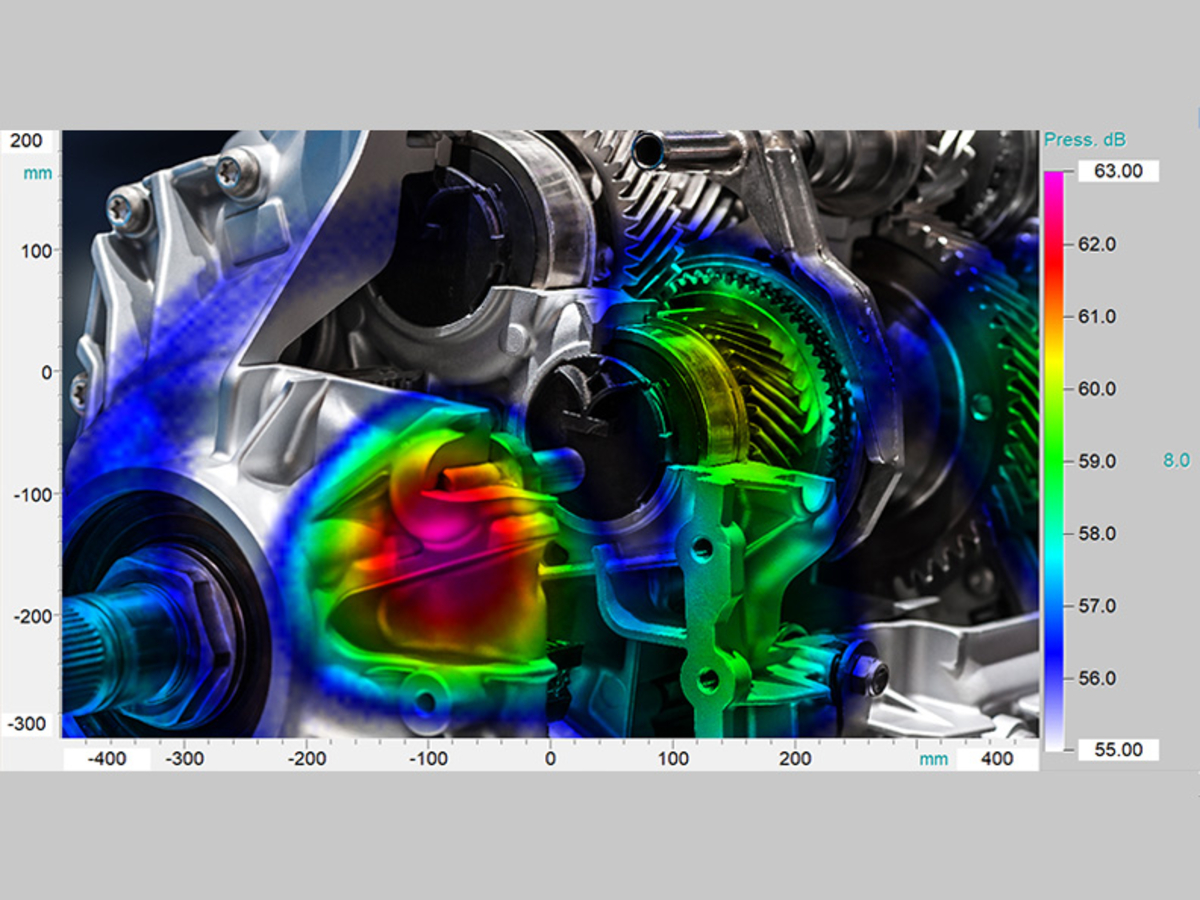
Based on the analysis results, you are enabled to quickly localize noise emissions and e. g. compare prototype iterations. The results also allow to narrow down regions of interest for more detailed testing including vibration analysis and troubleshooting of resonance effects.

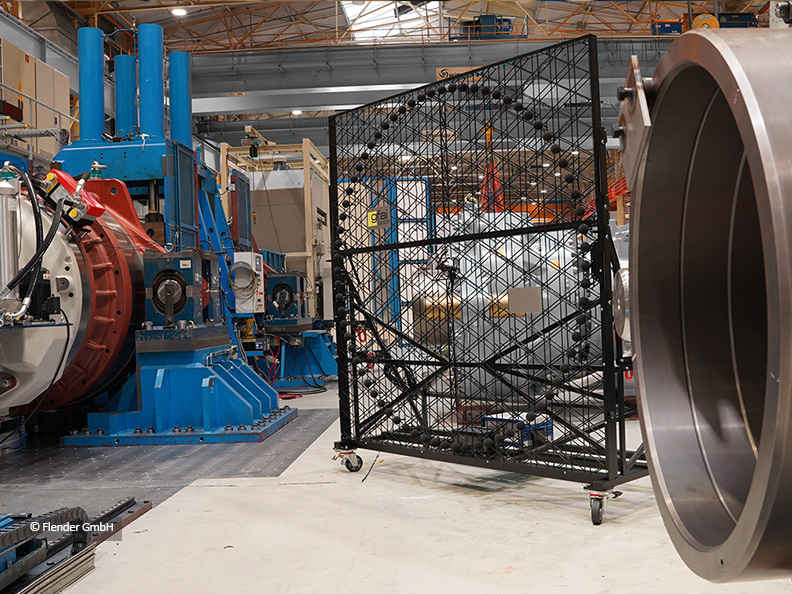
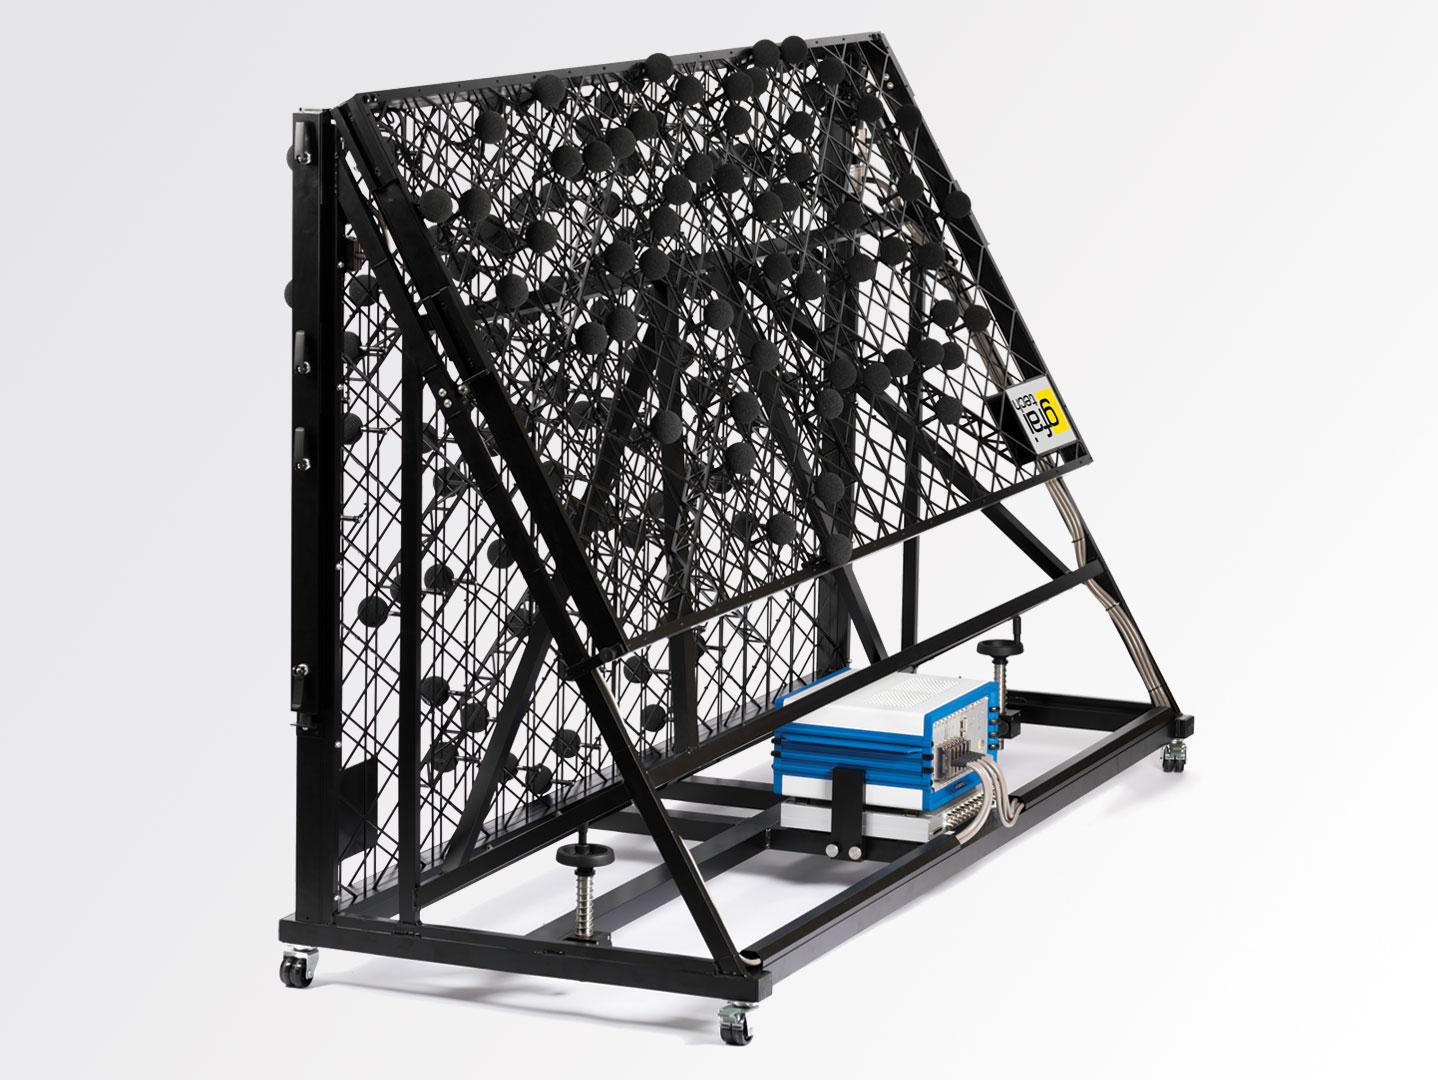
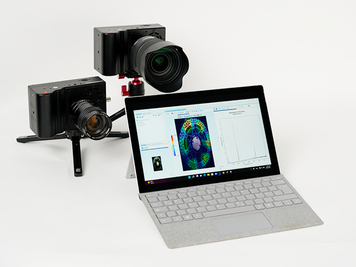
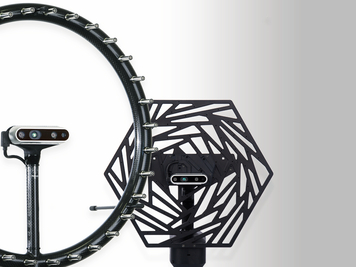
The array used in this example can be used for testing on ground level as well as for suspended operation using a crane e. g. to cover the top view. It is foldable for transport.

The powerful data recorder collects data at 192 kS/s of up to hundreds of channels including individual microphones, accelerometers and rotational speed sensors. Analyses can be automated by the Project Manager. This NoiseImage module allows you to transfer measurement and analysis configurations to entire measurement campaigns.

Benefits

  • Fast and easy measurement setup and analysis
  • Analyze data based on multiple different rotational speeds
  • Detailed and meaningful results
  • Test bench integration, extend vibration testing
  • Add accelerometers etc. as required
  • Large choice of arrays for different requirements