Three-dimensional beamforming is becoming increasingly significant in technical applications but requires microphone arrays with many sensors, especially when used for analyses of large items. Furthermore, a model of the measuring object is required and its position relative to the microphone array needs to be determined. DynaBeam is the a technical solution which handles these problems and steps during one single measurement.
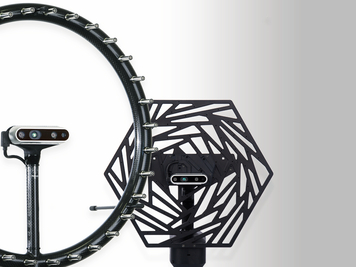
For this purpose, a portable and handy microphone array is used, which also contains an optical depth camera. With this special camera, the positions of the microphones and a three-dimensional model of the measuring object can be determined.
3D data is acquired by means of the 3D scanner. This data is used to calculate the 3D model. Additional optical data can be acquired prior to the acoustic measurement in order to enhance the quality of the 3D model. Apart from the model and the acoustic data, the trajectories which the microphone array and the camera are moved on are recorded during the entire period of measurement. Subsequently, the three-dimensional model is generated and saved.
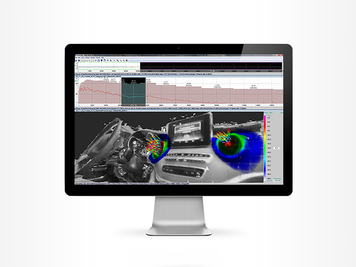
Acoustic data can be analysed by an arbitrary beamforming algorithm in the time or frequency domain. The trajectory points within a specific orbit range are put together to one measurement position. The acoustic map is calculated using the acoustic data corresponding to these measurement positions.
In each acoustic map, the source strength is calculated only for points on the measuring object that are ‘visible’ to the microphone array or its optical camera, respectively. If a point on the measuring object is visible from several microphone-array trajectory points, several source strengths for this point on the measuring object exist. In this case, the average source strength is used. To be displayed in the resulting averaged acoustic map at all, it is then checked if the point on the measuring object had been visible to the microphone array for a certain period of time, which corresponds to the marked time span of the microphone channels.
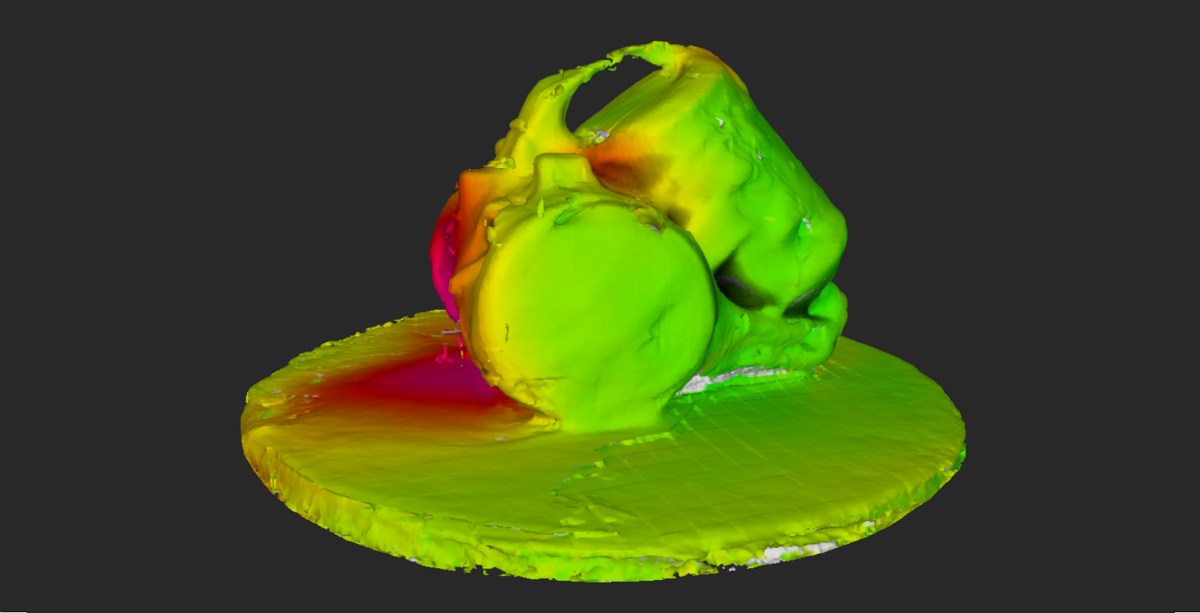
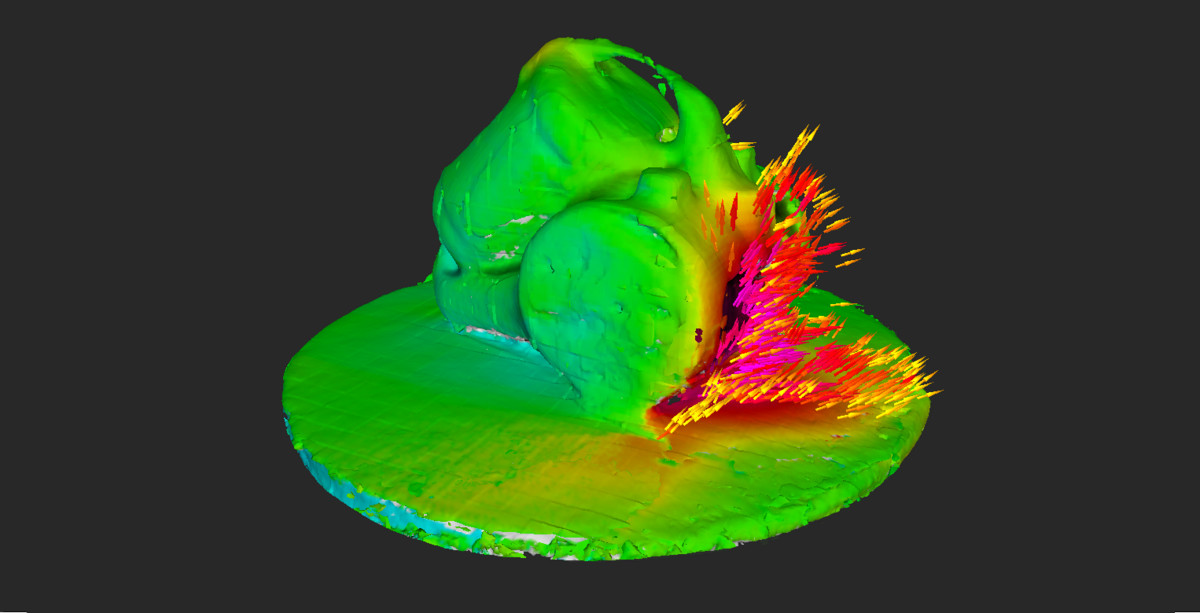
Application Example: Vacuum Cleaner
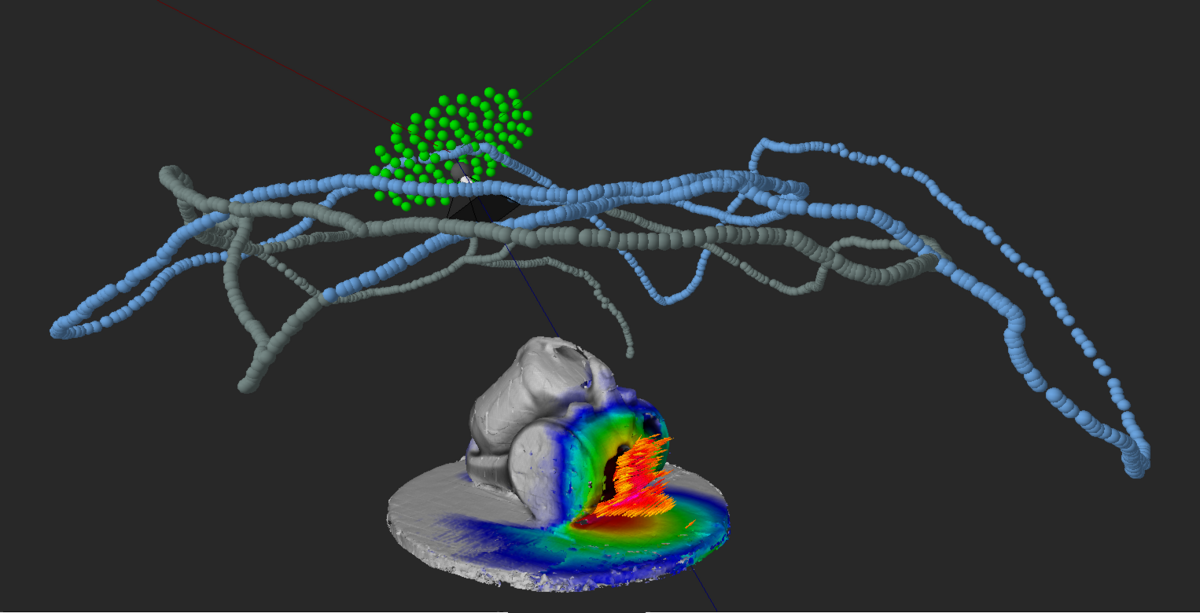
Apart from calculating an acoustic map, DynaBeam also allows to determine a sort of main directivity, which points from each point on the measuring object to the position of the trajectory of the microphone array where the biggest source strength was calculated.
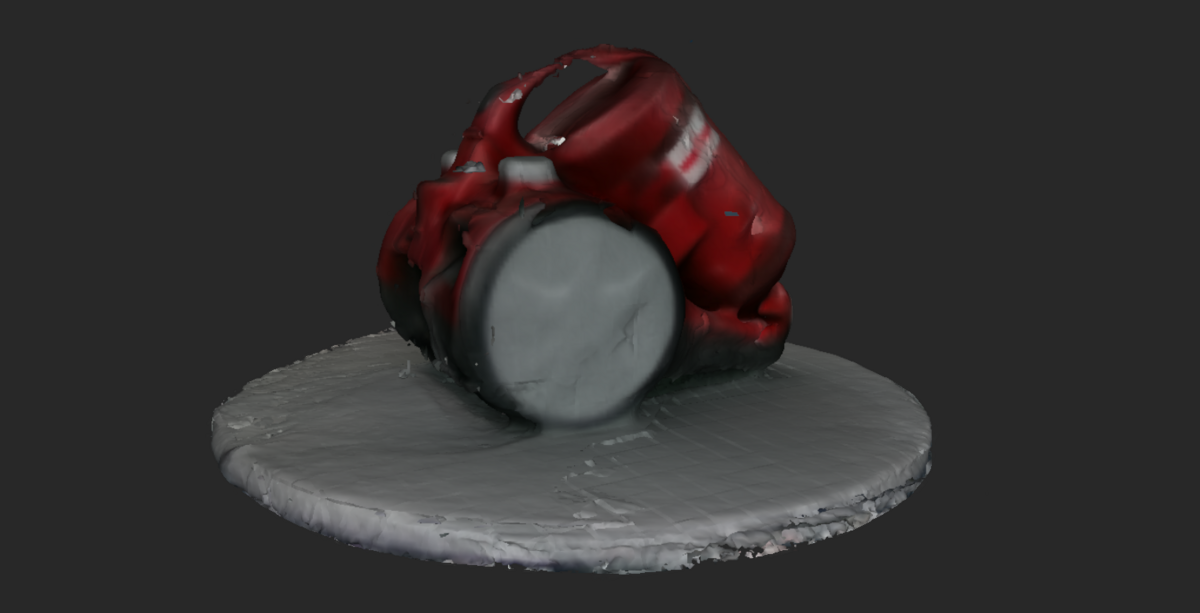
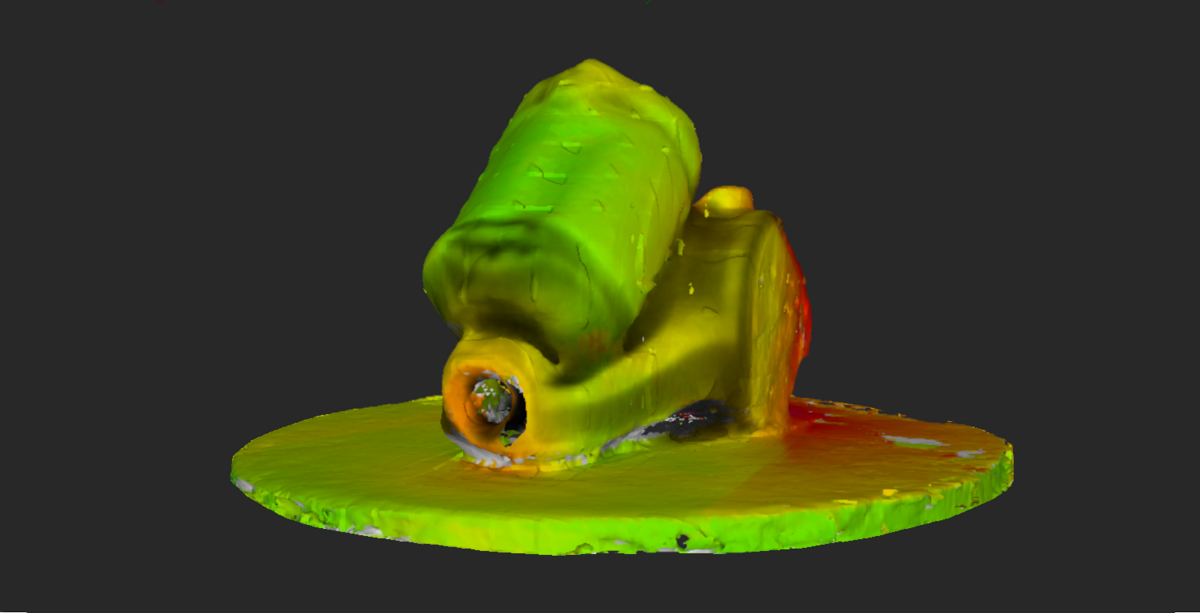
Figure 1 shows an evaluated DynaBeam measurement of a vacuum cleaner. The blue dots mark the trajectory of the recorded acoustic data. The three-dimensional model of the measuring object as shown in figure 2 has been generated from the blue and grey dots. Figure 3 illustrates a small sound source of the same evaluation at the front of the vacuum cleaner. Figure 4 shows another small source at the top. Figure 5 represents the loudest source marked with arrows to visualize the main directivities.