Whether washing machines, coffee machines or turbo trainers: household appliances and consumer products should should aim to be exceptionally quiet while delivering high-quality sound.
Acoustic measurement methods are therefore used both in the development phase and in the maintenance and servicing of devices and equipment, and vibration analyses are carried out to localize noises and optimize products.

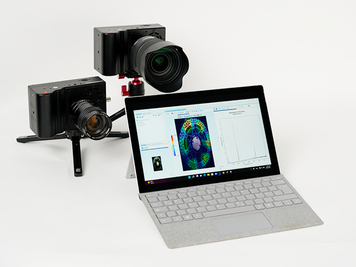
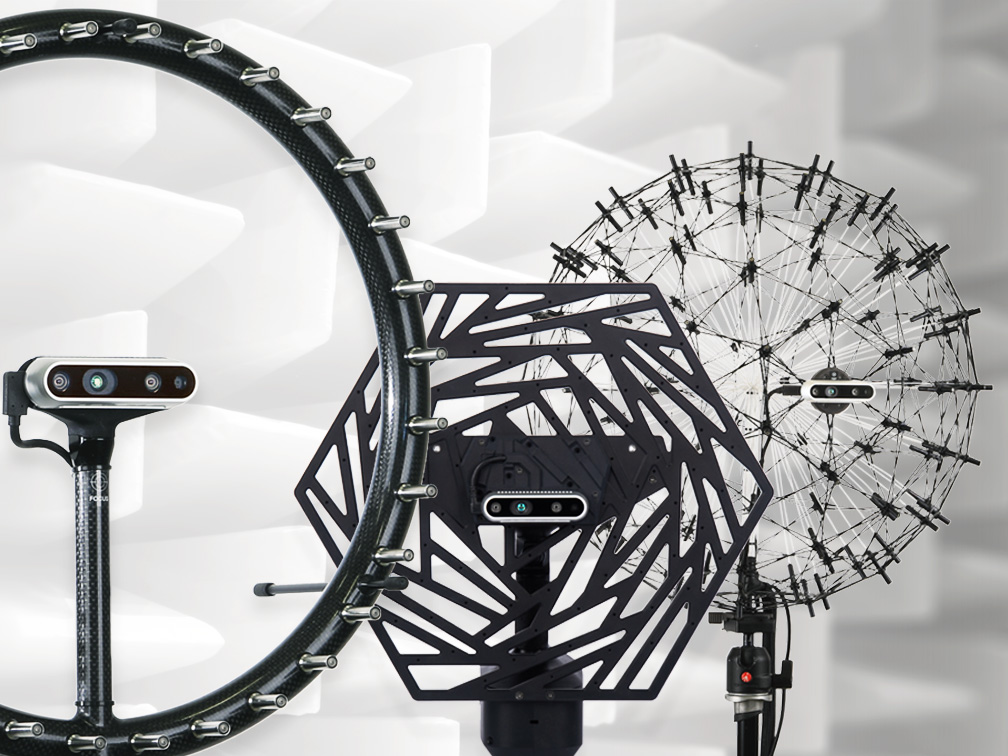
Our various Acoustic Cameras, whether AC Pro systems or all-in-one sound cameras, are used in the identification and analysis of noise sources, troubleshooting, and sound design optimization. By quickly identifying these noise sources and providing solutions, manufacturers and developers can save time, adapt their products more quickly to customer requirements, and effectively eliminate potential defects.

In product development, the Acoustic Camera also helps to ensure that the next generation of household and leisure appliances has a first-class sound design. This improves the customer experience and increases the appeal of the products. Acoustic maps help identify where manufacturers need to target to reduce sound emissions from appliances, machinery and equipment and comply with regulatory limits. The areas of application are as diverse as the products themselves: Mobile or stationary, small or large - sound measurements can be carried out on a wide variety of equipment.

Acoustic measurements with the soundcam Mikado

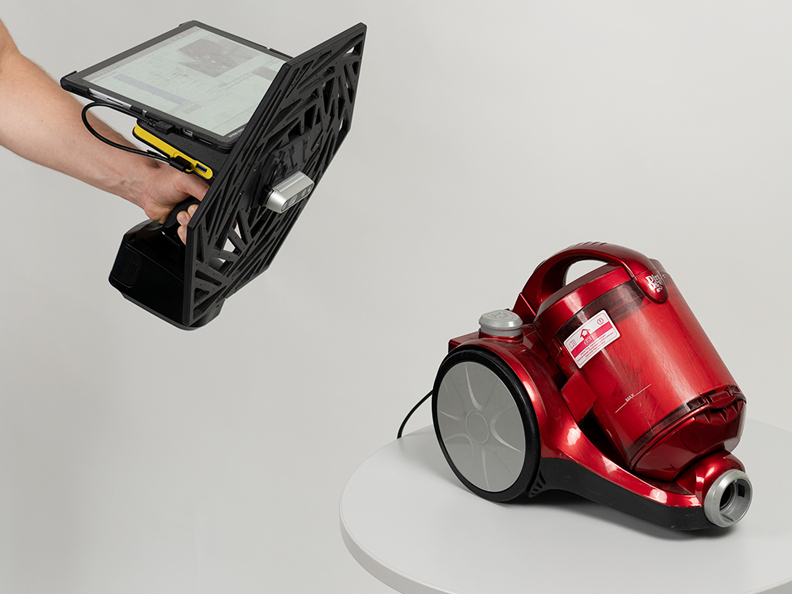
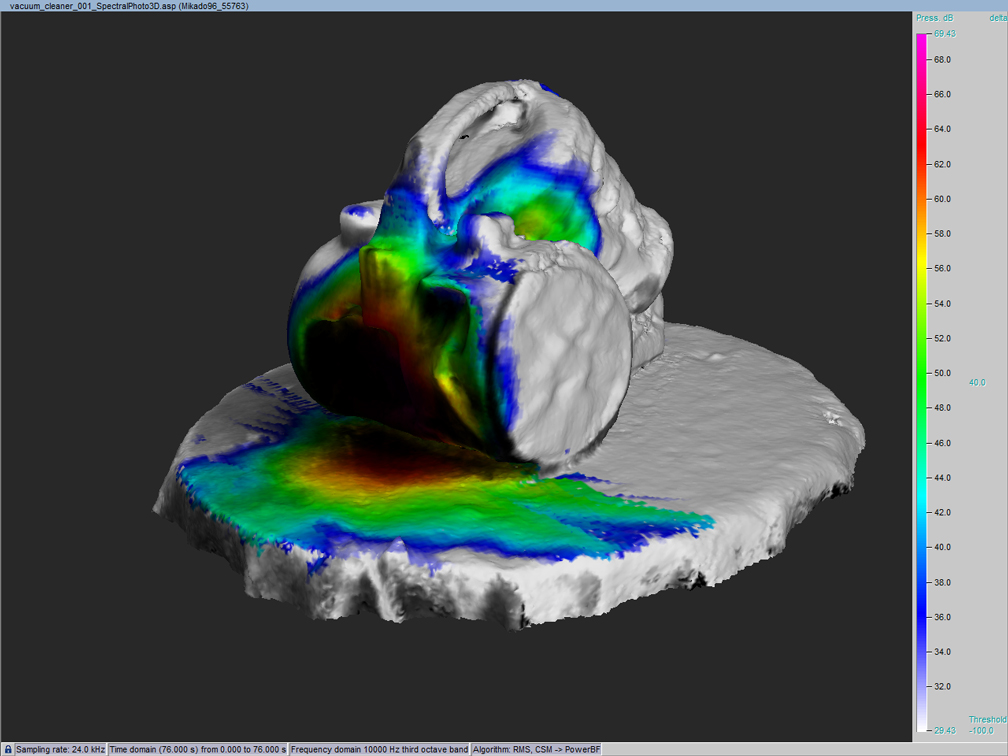
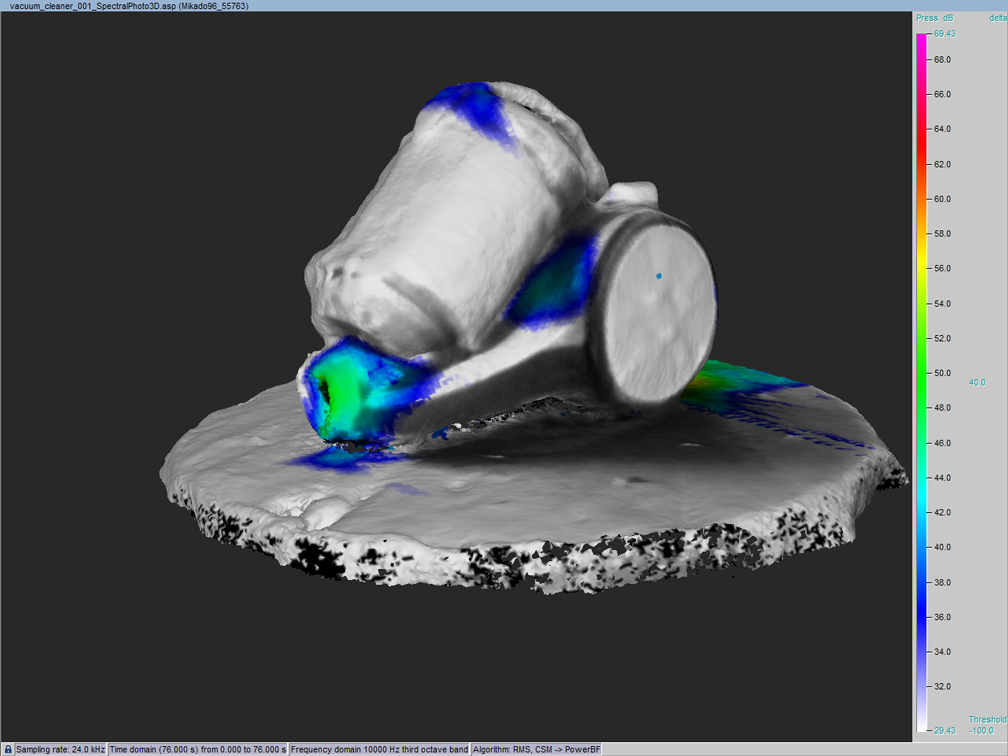
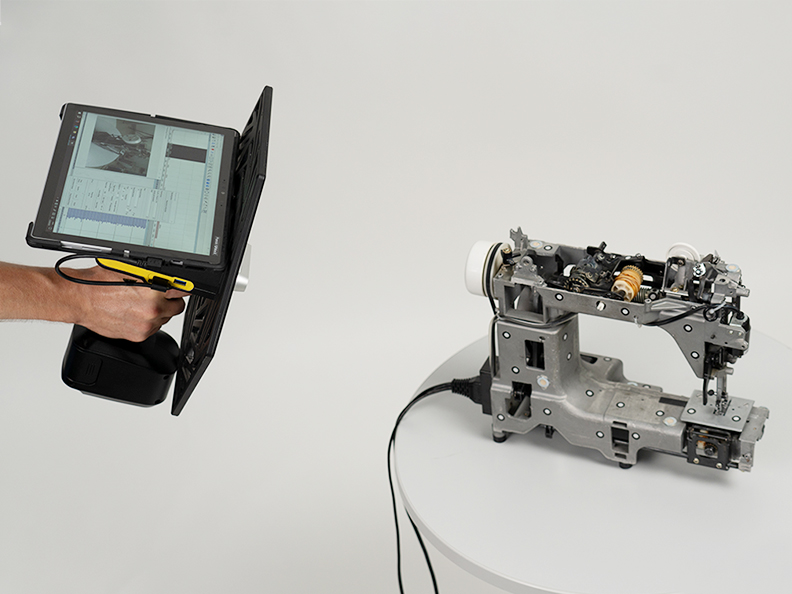
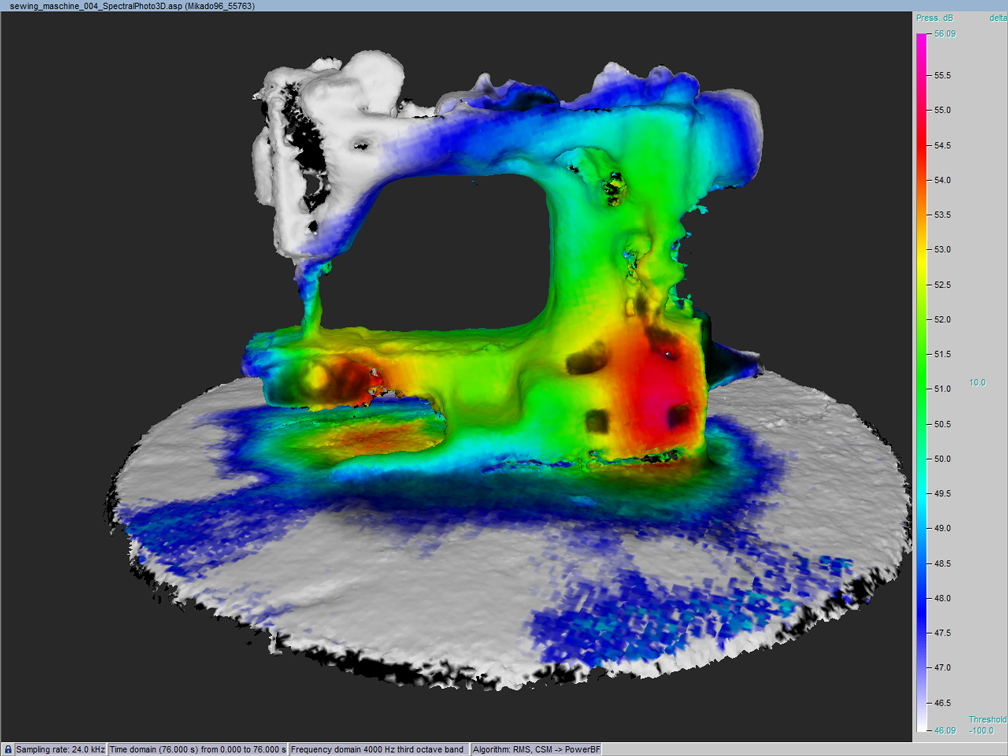
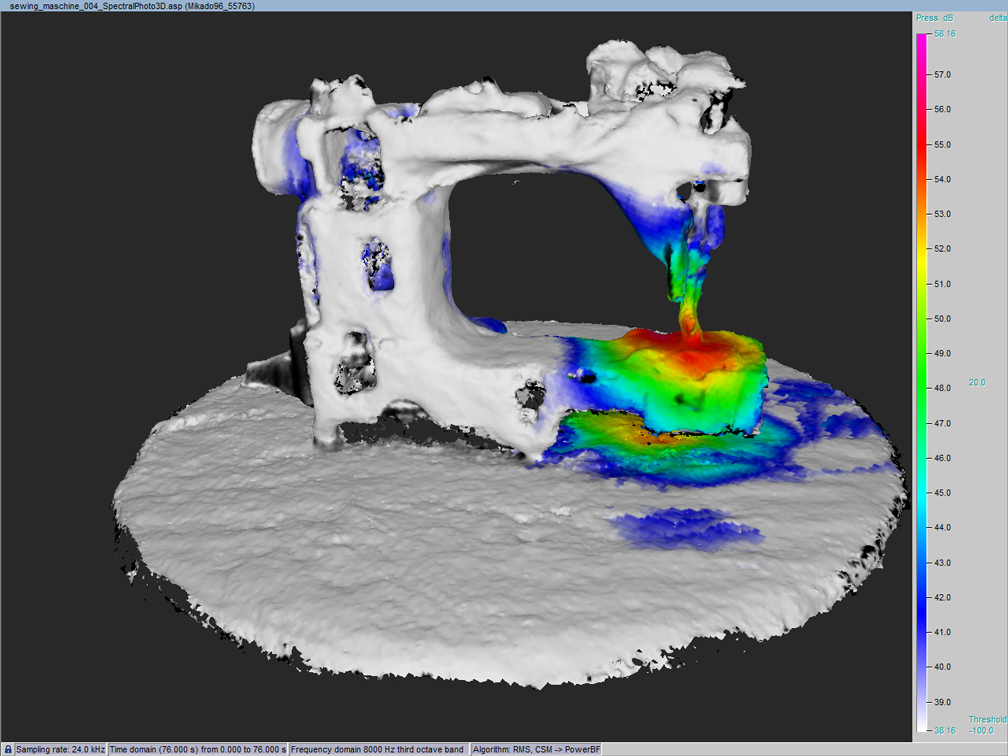
The following examples show acoustic measurements on a vacuum cleaner and a sewing machine. They were performed with the all-in-one sound camera Mikado. During the measurement, a 3D object was simultaneously scanned in real time, and calculations were made using gfai tech's advanced power beamforming algorithm. This enabled the acquisition of a detailed "acoustic fingerprint" of the measured object with only one measurement.

The high quality of the acoustic maps is due to both the DynaBeam method and the power beamforming algorithm, which were used in conjunction with the array's high microphone density. The resulting images are an impressive example of state-of-the-art acoustic measurement technology and its application in industry.

Acoustic Measurements on Vacuum Cleaners

Vacuum cleaners often have to comply with certain noise standards and limits. The Acoustic Camera helps manufacturers reach these standards by measuring and analyzing sound emissions. This allows targeted measures to be taken to reduce noise to the prescribed limits. However, this does not mean that a quiet vacuum cleaner will necessarily have a lower suction power as a result.

The result images of the measurement created with the Soundcam Mikado show an acoustic map, created in the third octave of 10 kHz.
The most noticeable sound source is clearly the air outlet of the vacuum cleaner. The color map visualizes that the high volume there is the dominant sound source in the frequency range.
On the top of the vacuum cleaner housing, another sound source can be seen that is much quieter compared to the air outlet, with about 15 dB less sound pressure. This source is characterized by a softer coloration and appears to be a secondary sound source.
The second result image shows the air inlet as the third source.

Sound Localization on Sewing Machines

The Acoustic Camera is also used in other everyday products, such as sewing machines, to localize sound sources. During the operation of a sewing machine, various sounds can occur, such as the movement of the needle, the winding and unwinding of the thread, or the cutting of the fabric. Using an Acoustic Camera, producers can accurately identify and analyze these noise sources. Quieter operation of the sewing machine makes work more comfortable and can thus improve concentration.

The acoustic map of the sewing machine in the first image was created at 4 kHz third octave. The loudest sound sources are clearly located on the motor and on the housing near the needle.
The measurement at 8 kHz third octave in the second image shows that the most dominant sound source is found by the excitation of the needle.


Sound and Vibration Measurement Examples

By activating external content from Youtube, you consent to transmitting data to this third party.

The sound of coffee

In the video, the Acoustic Camera Ring Array Pro identifies the sounds of a small coffee machine. The Acoustic Camera shows which components or processes produce the greatest sound emissions. The NoiseImage software visually displays the results and analyzes the acoustic maps.

With the help of acoustic analyses, developers and manufacturers can take specific measures to optimize the sound profile of the device. Specific improvements to these components, such as using sound-absorbing materials, optimizing mechanical parts or adjusting operating parameters, can minimize any undesirable noise. The optimized sound profile of the coffee machine can then contribute to a more pleasant listening experience while enjoying the coffee

By activating external content from Youtube, you consent to transmitting data to this third party.

Sound Source Analysis on Household Equipment with Soundcam Mikado

In this example, the mobile all-in-on soundcam Mikado was used for measuring household appliances in an acoustic lab.

By activating external content from Youtube, you consent to transmitting data to this third party.

Acoustic Camera: DynaBeam - 3D Scanning and Sound Localization on an E-Bike

The Acoustic Camera is used to visualize sound sources with patentend solution DynaBeam on an e-bike.

By activating external content from Youtube, you consent to transmitting data to this third party.

Acoustic Camera: DynaBeam - Measurement of Noise Cancelling Headphones

This video shows the application of our patentend solution DynaBeam on Sony WH-1000XM3 headphones. See how we measure the acoustic and the 3d-model at the same time. Because we measure from all side, In the analysis we see where the headphones emit noise.

By activating external content from Youtube, you consent to transmitting data to this third party.

WavecCam: Vibration Analysis of Loudspeaker

The vibration analysis software WaveCam visualizes the vibrations with a motion magnification and analyzes the data here in the video using the example of a loudspeaker.

The excitation was done with a sine sweep. The recorded video data was amplified in motion by software. Compared to classical sensor systems, the results are extremely accurate.